 WhyLens
Automatic insights that explain
what changed and why
Drop WhyLens on any Tableau dashboard. It reads the worksheets you choose and builds a full, interactive insights dashboard: trends, drivers, profitability, customers, forecasts and unusual periods, written in plain language.
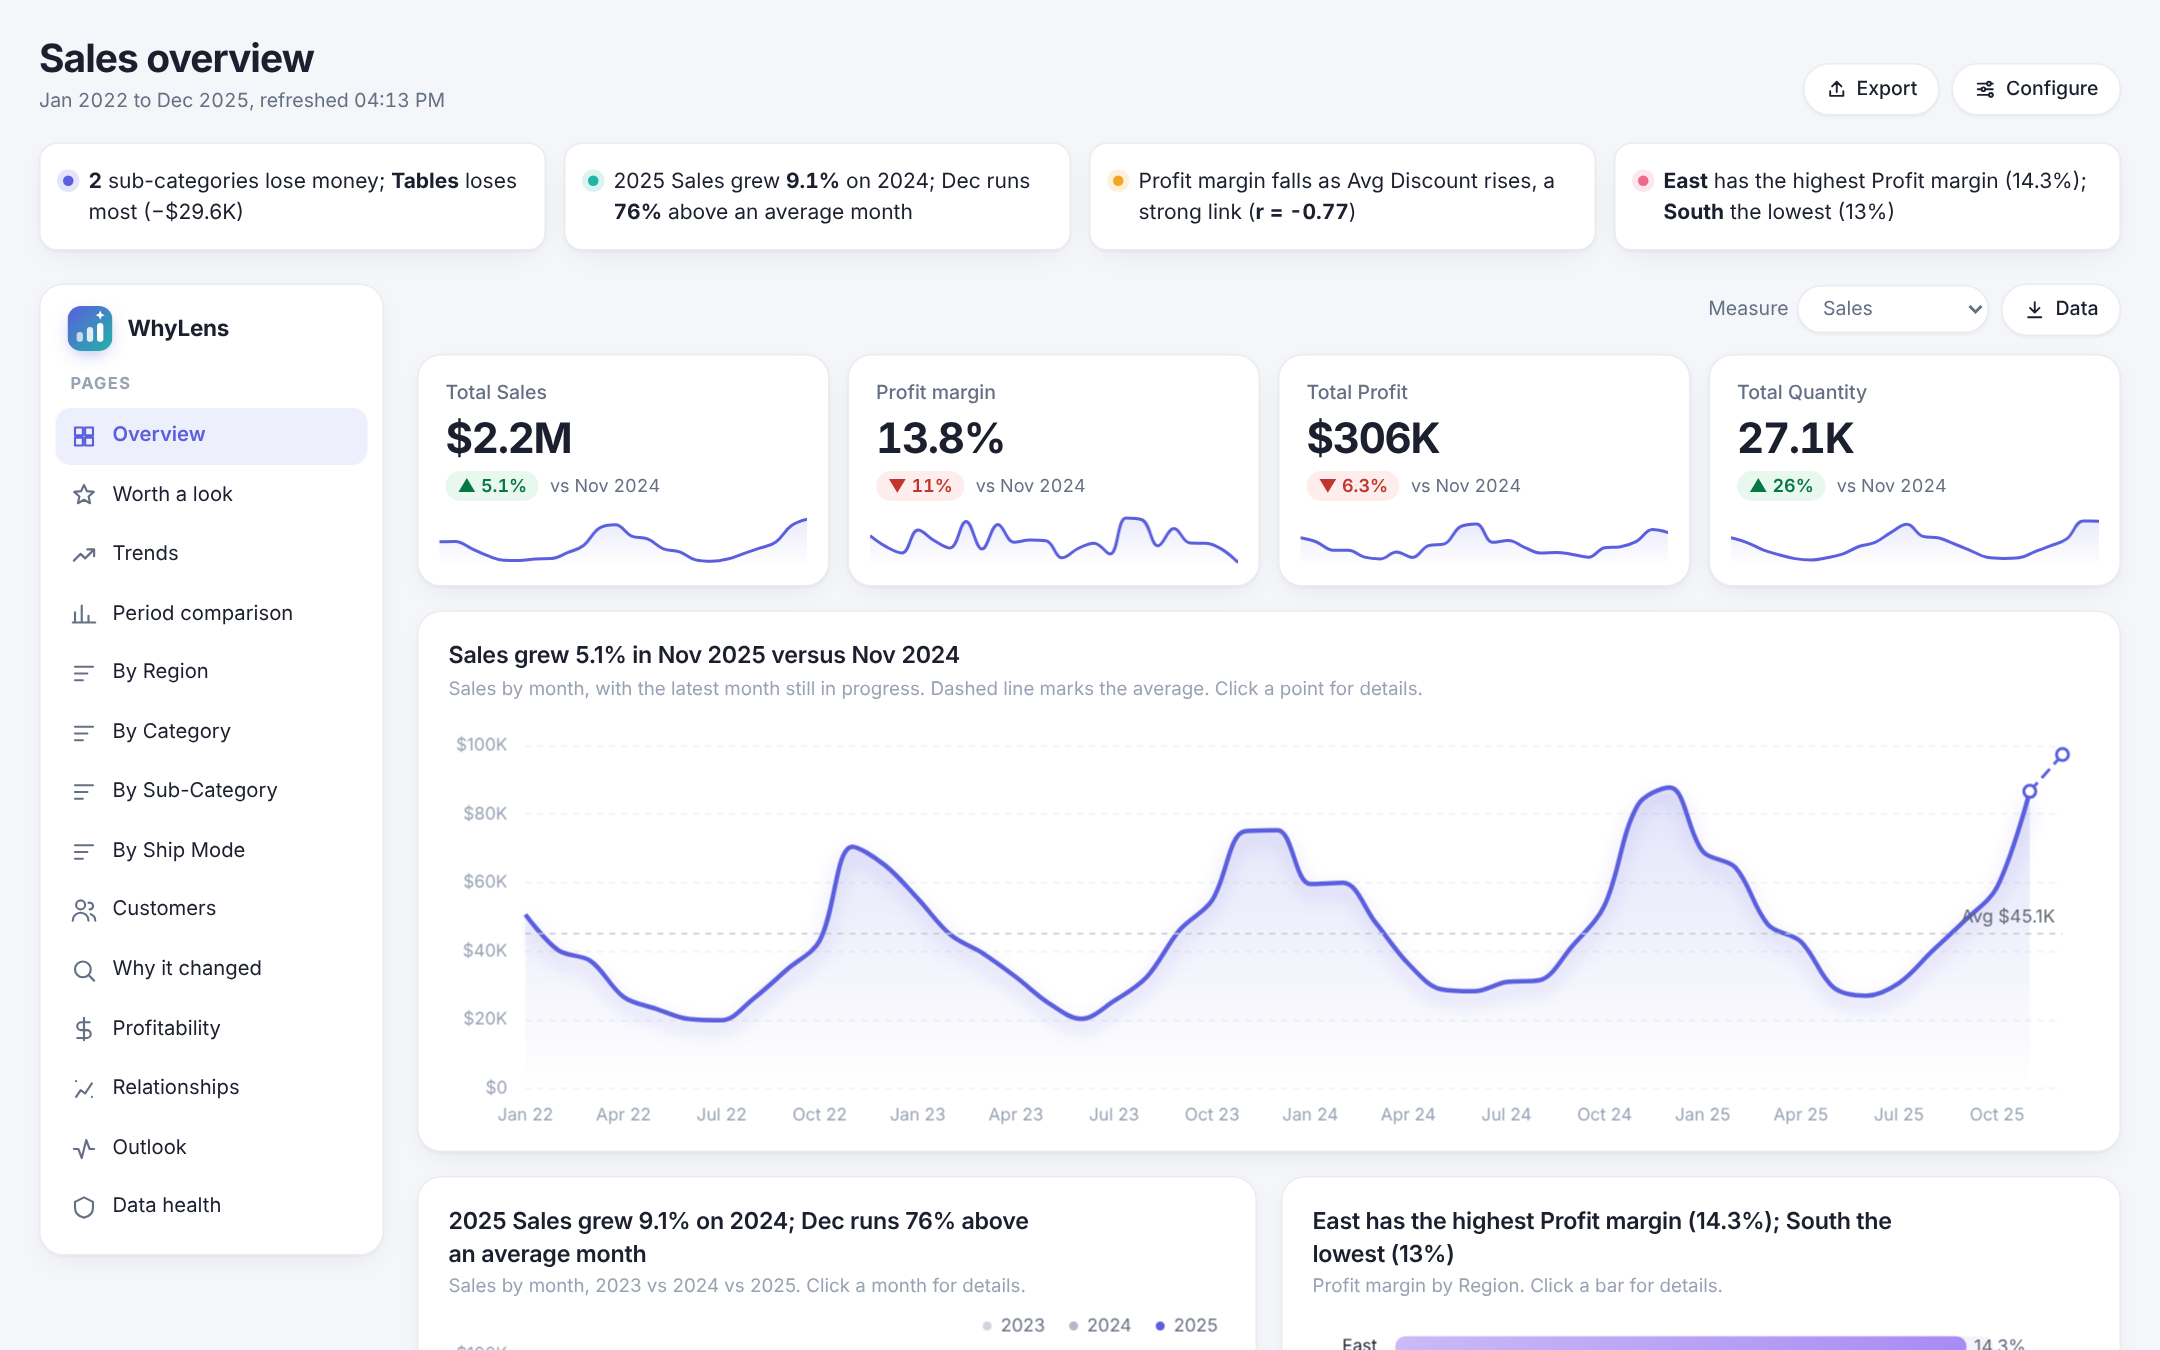
An analyst's first pass, in seconds
No setup, no calculated fields, no templates. WhyLens works out what your fields mean (money, counts, rates, dates, regions, customers, products) and picks the analysis that fits.
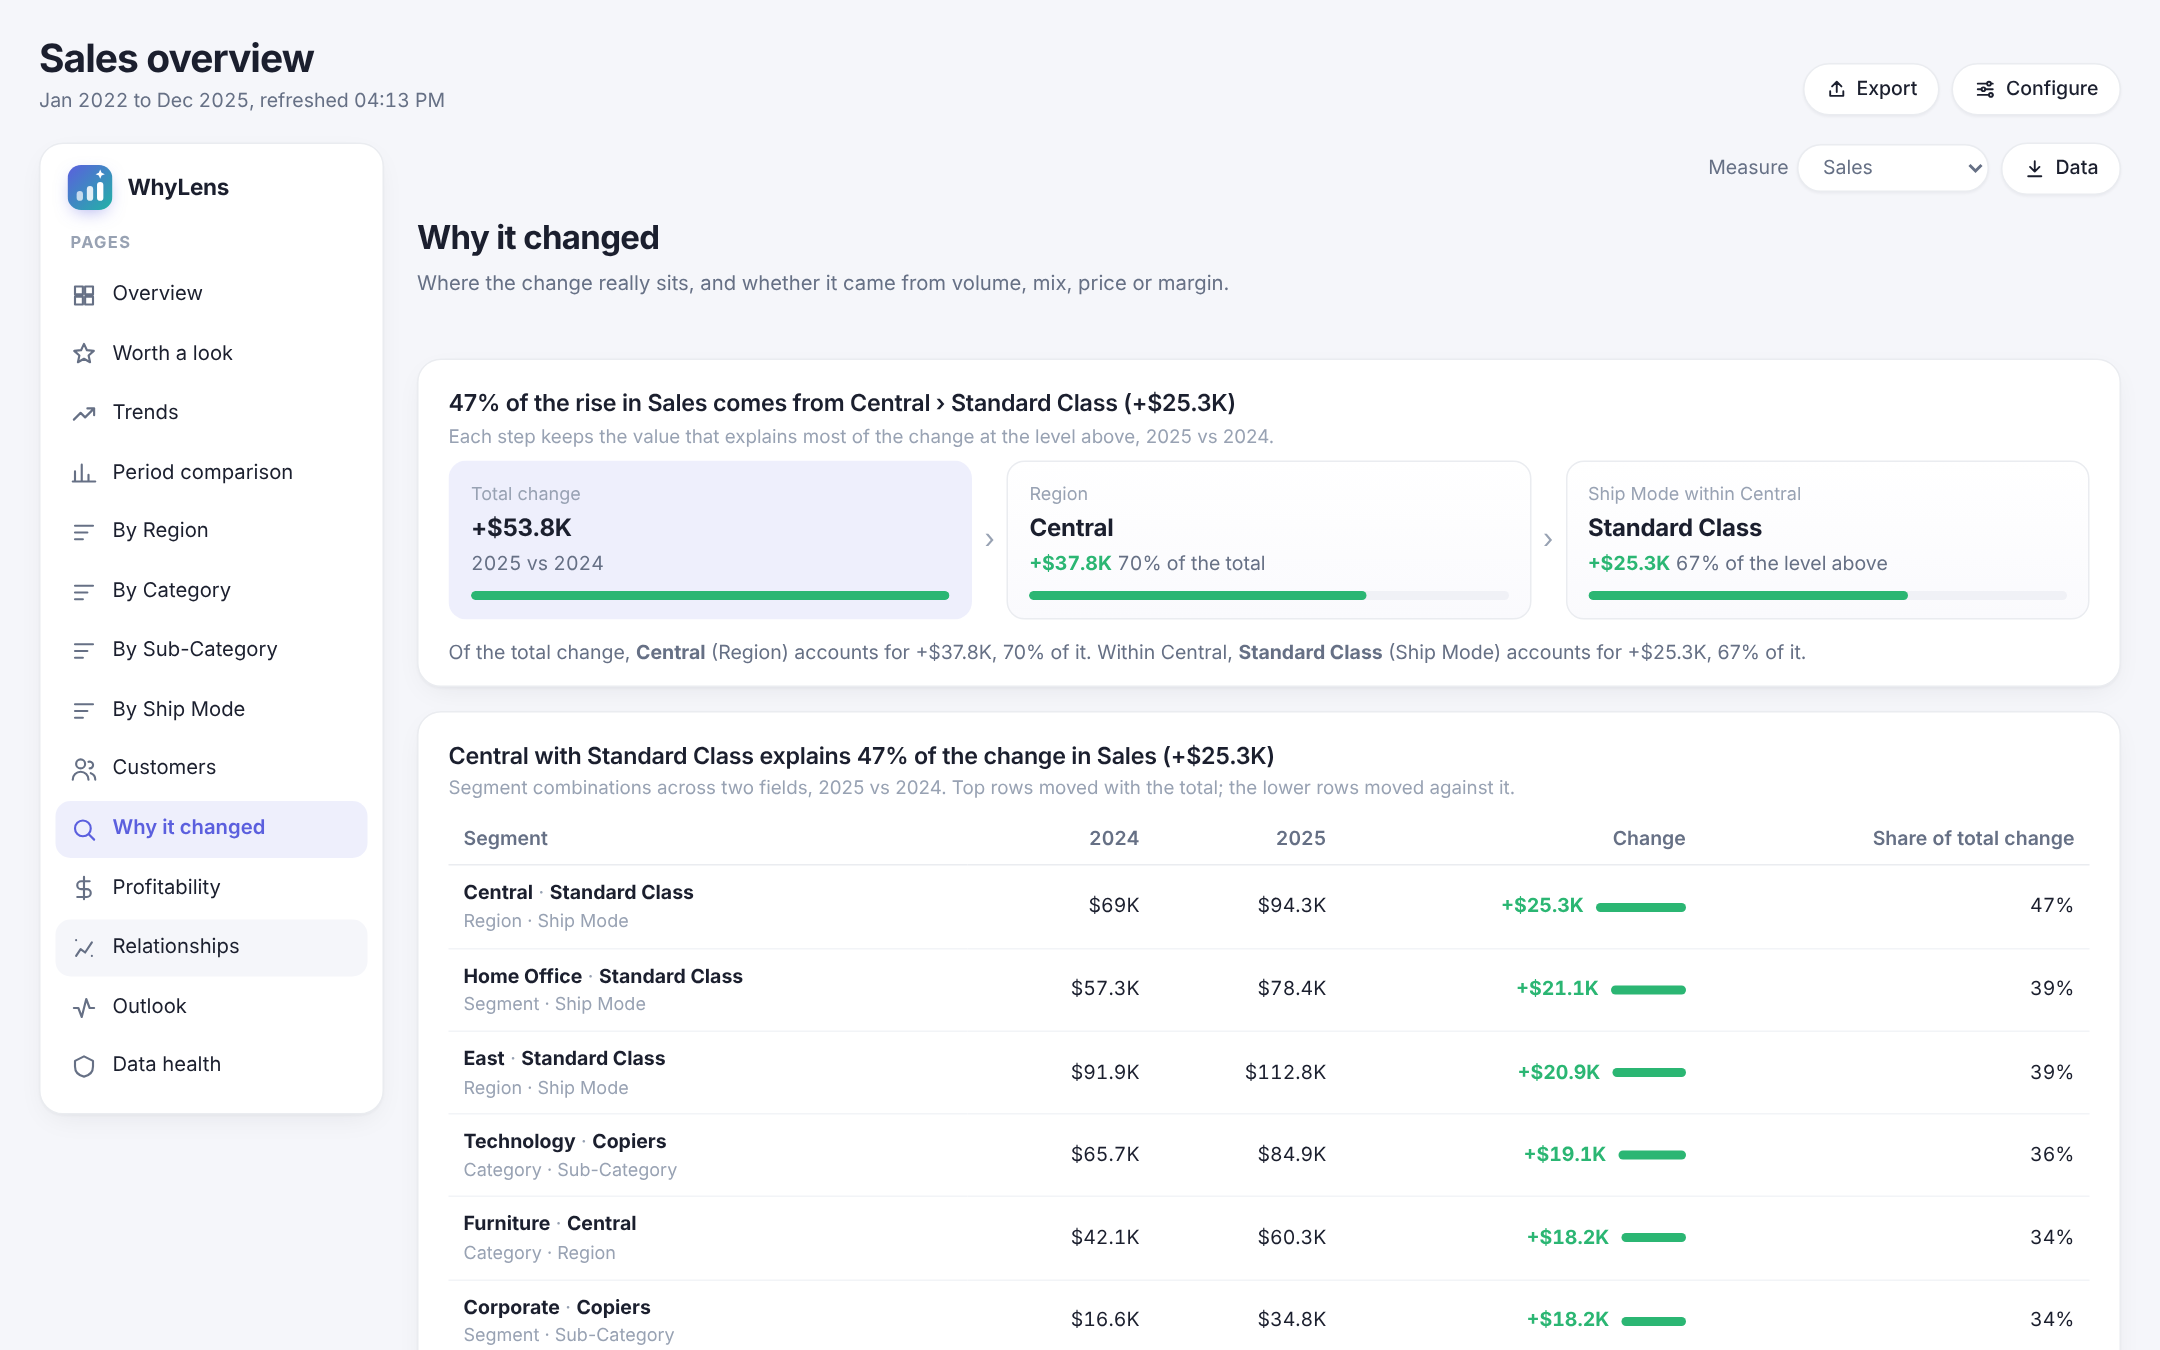
Why it changed
Drills the change down to the segments that caused it, and splits it into volume, mix, price and margin effects.
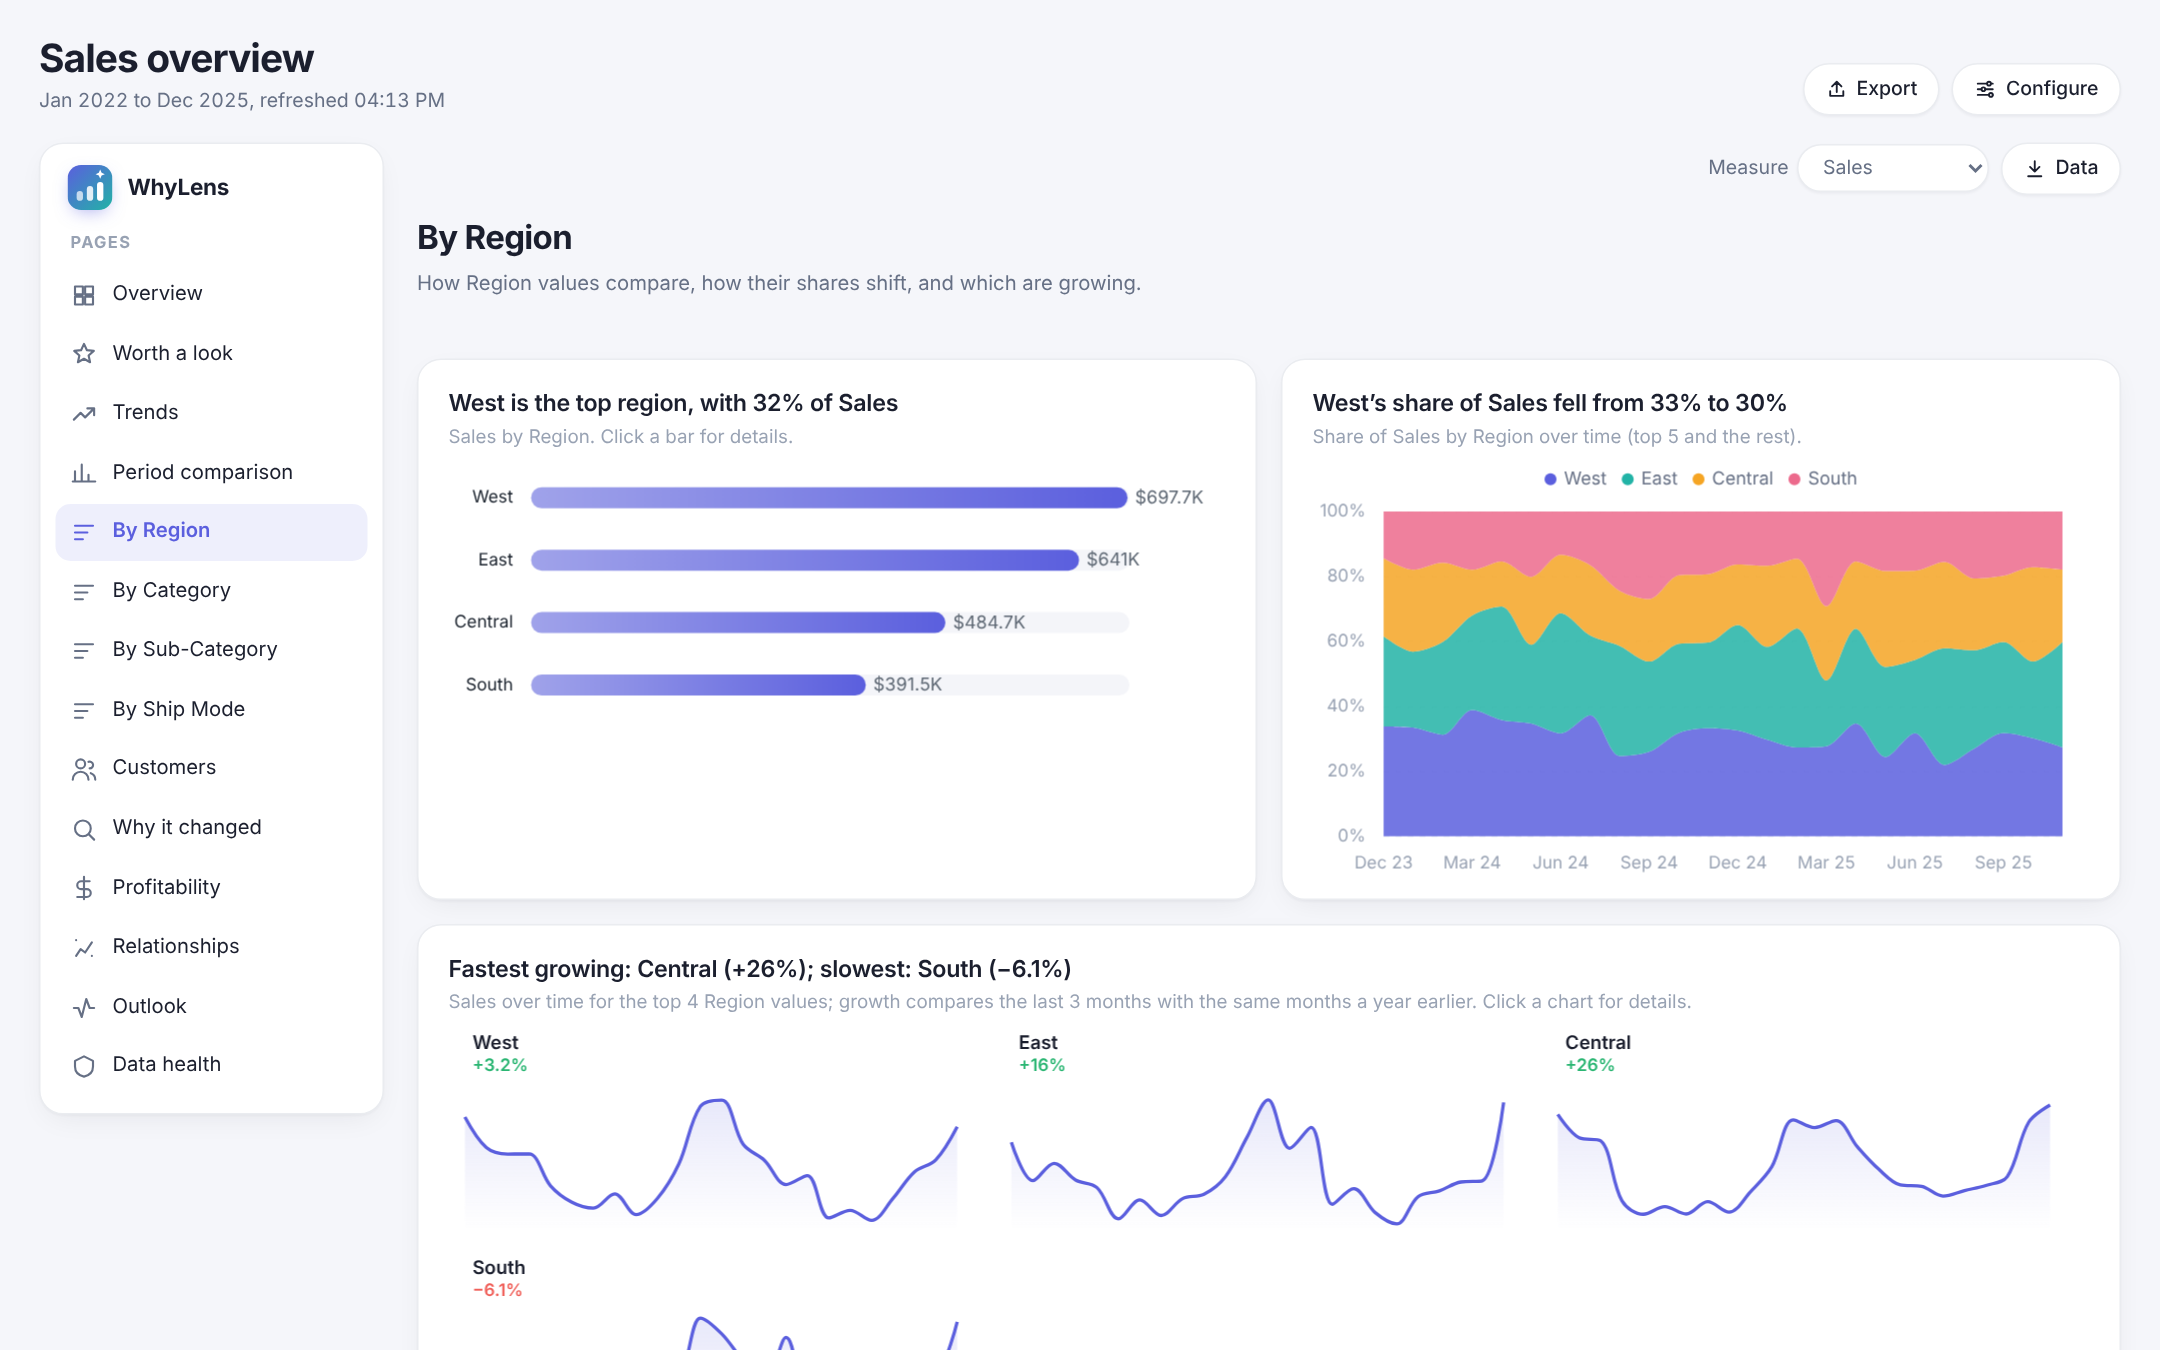
Trends and seasonality
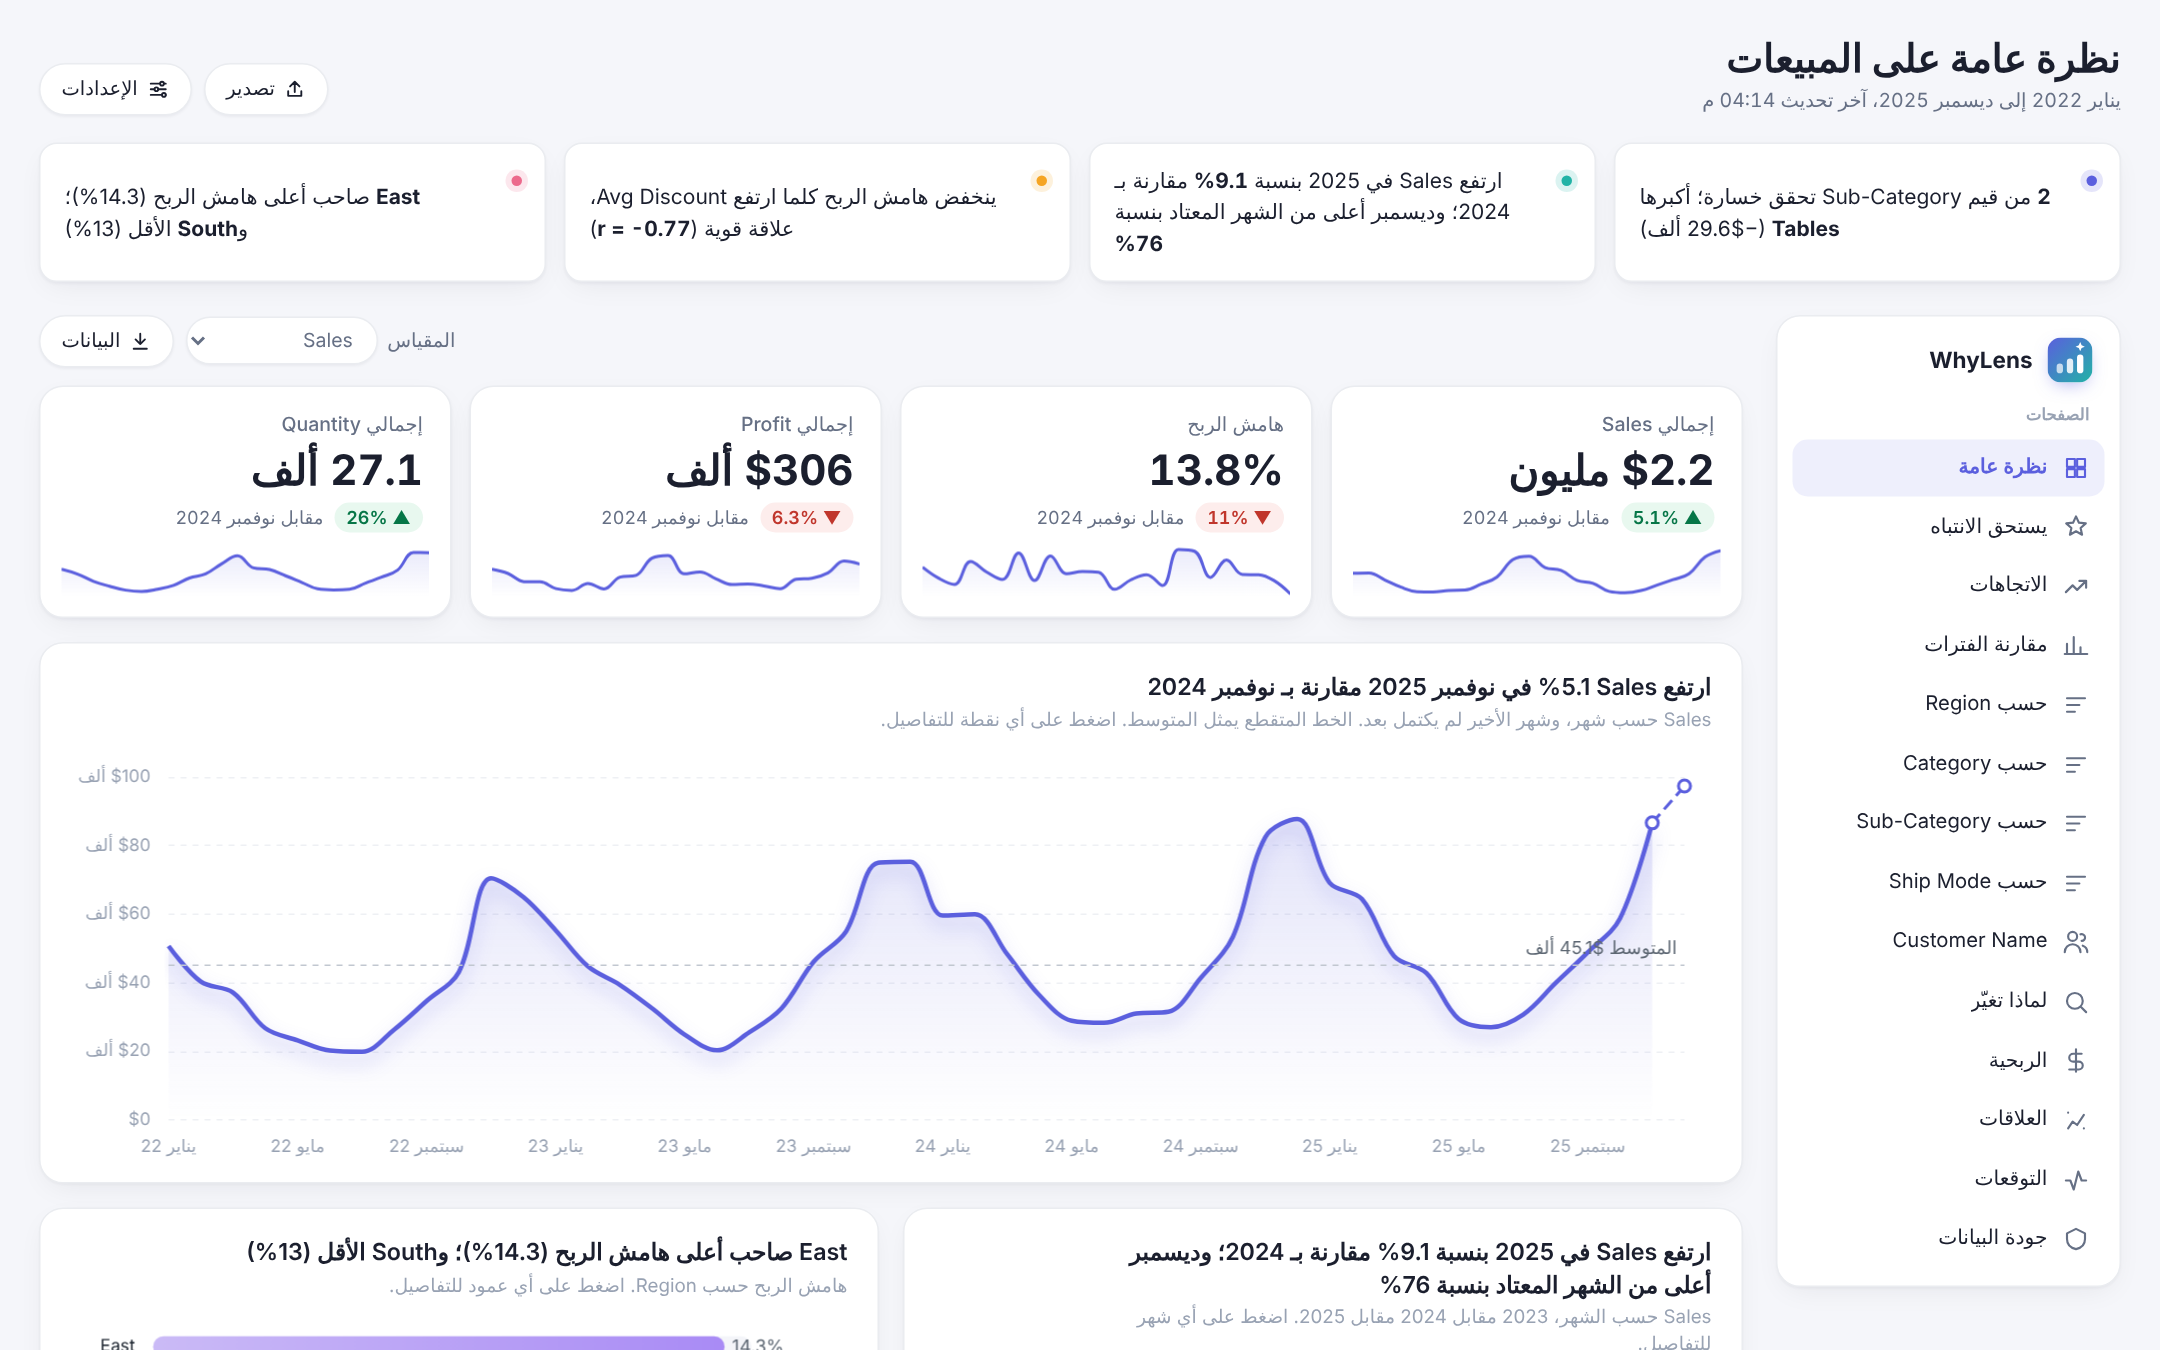
Year-over-year, seasonal patterns, weekday rhythm and period comparisons, with seasonality kept separate from real surprises.
Profitability
Where margin is made and lost: loss makers, discount break-even and margin mix.
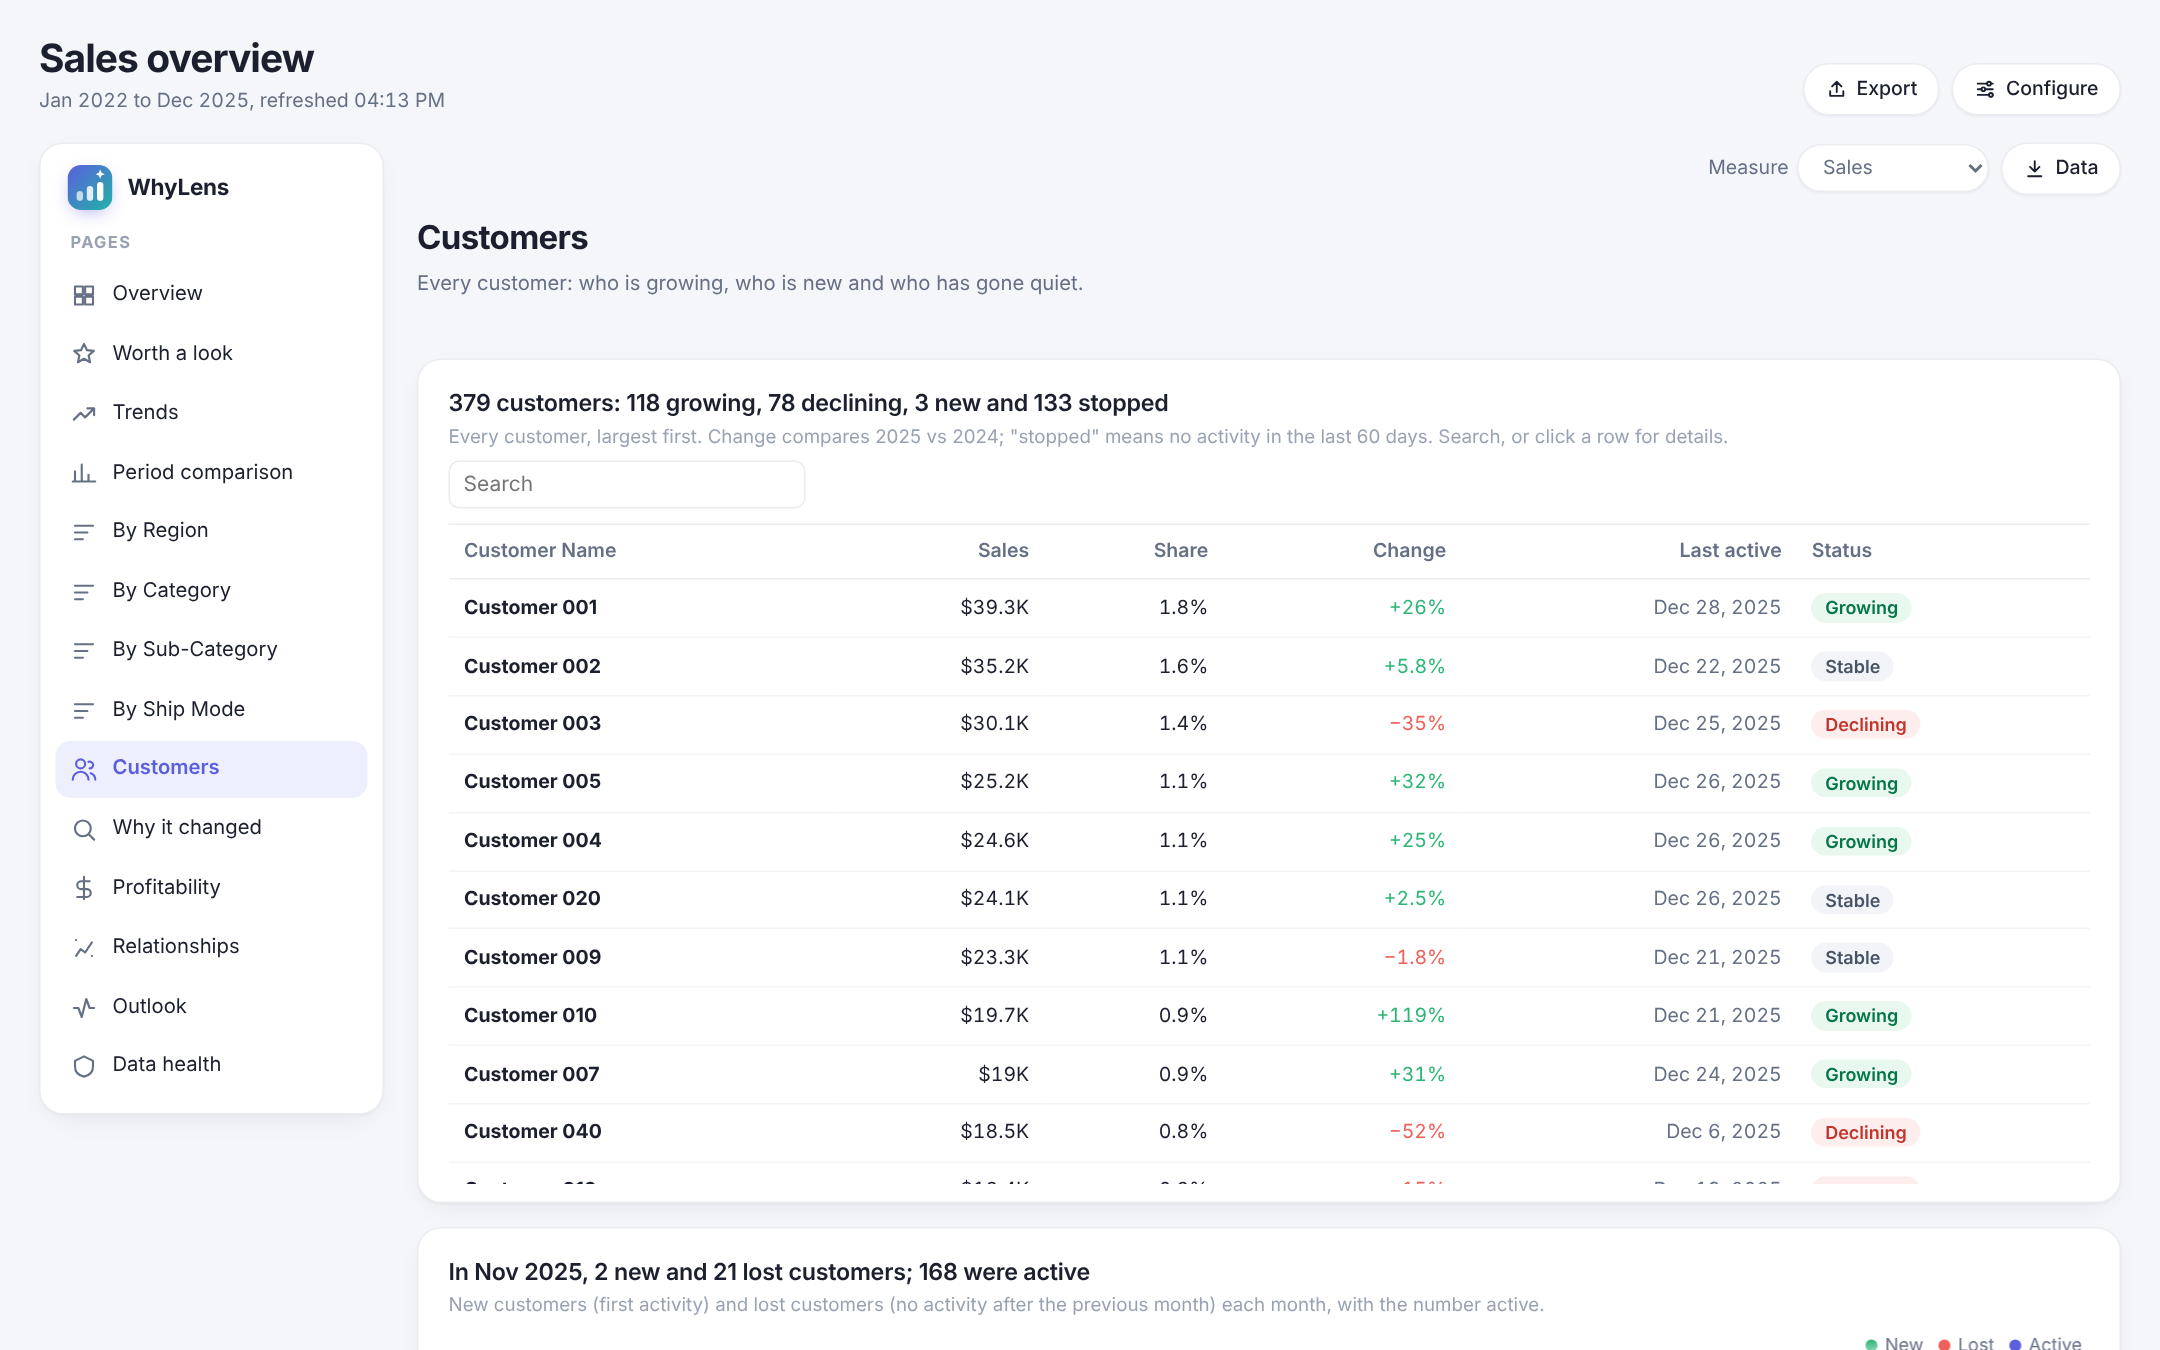
Customers and products
Who is growing, who is new and who has gone quiet; Pareto concentration and top movers.
Outlook and anomalies
A seasonal forecast with a confidence band, and the periods that broke the usual pattern.
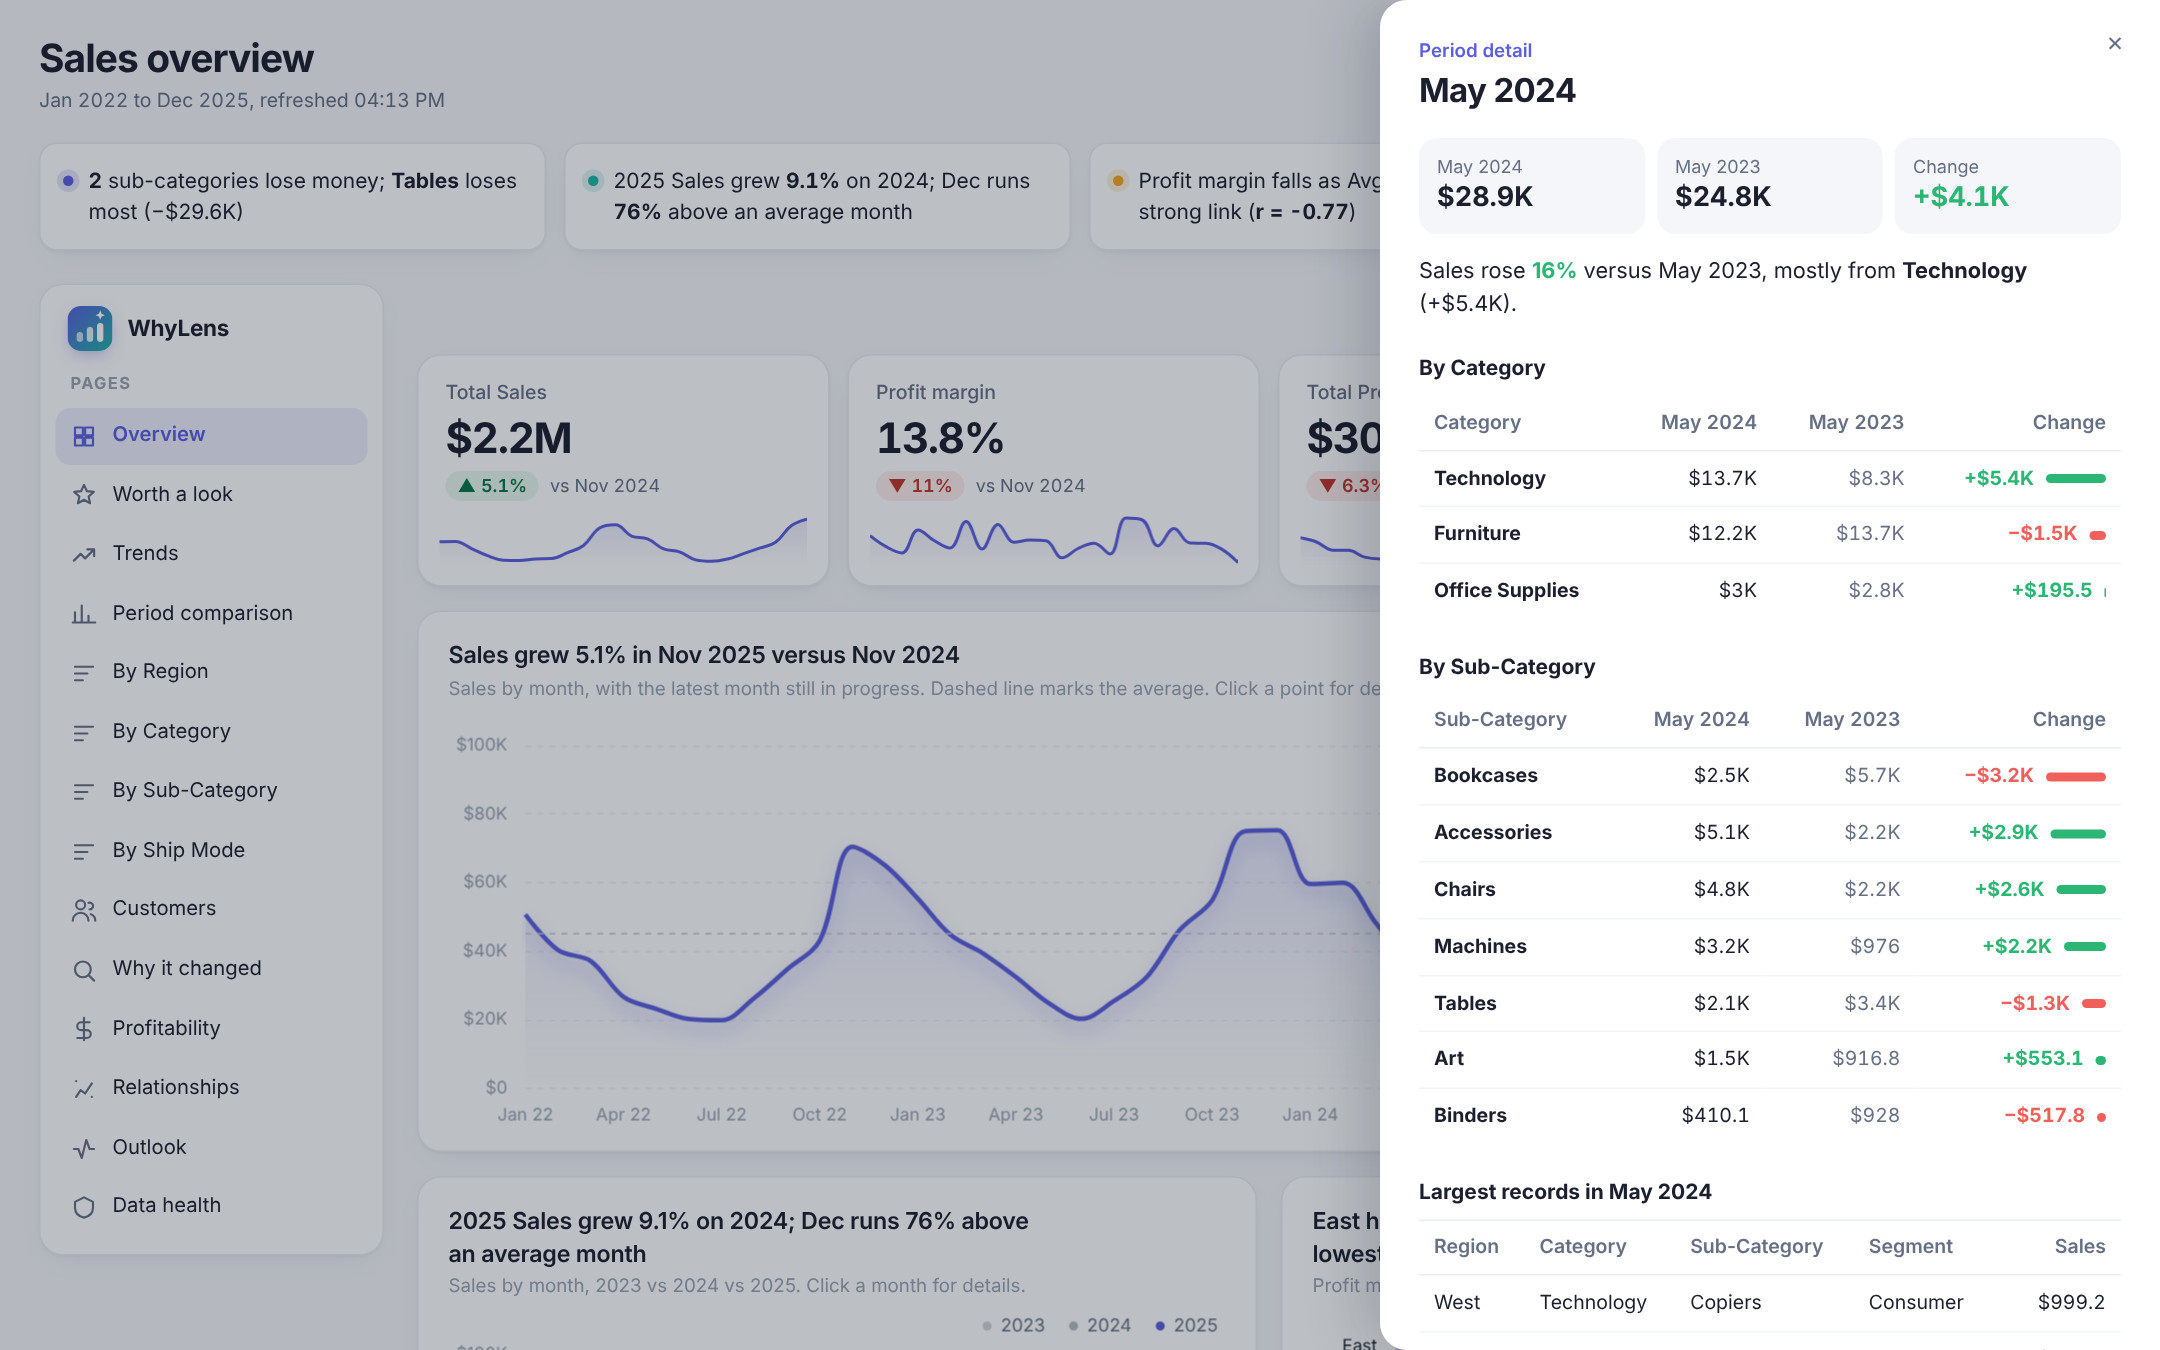
Click anything for detail
Every chart opens a detail panel: what drove that point, the biggest records, and a one-click filter.
PDF and PowerPoint
Export one page or the full report for your management meeting, ready to present.
English and Arabic
Full right-to-left Arabic interface and findings, with Arabic or Latin digits.
You stay in control
Choose sheets, measures, names and colours, and change the fields behind any chart.
See it in action
Shown here on a sample retail dataset. WhyLens works with any data source Tableau can connect to.
Your data never leaves your browser
WhyLens runs entirely inside the Tableau dashboard. It reads the summary data of the worksheets you choose, analyses it in your browser, and sends it nowhere. No accounts, no tracking, no servers storing your data.
- Reads worksheet summary data only, through the official Tableau Extensions API
- All calculations and exports happen on your device
- Settings are saved inside your workbook
- Read the privacy policy
Install in 2 minutes
Works in Tableau Desktop, Tableau Cloud and Tableau Server (2021.4 or later recommended).
- Download the extension file. WhyLens.trex (also listed on Tableau Exchange once approved).
- Add it to a dashboard. Drag an Extension object onto your dashboard, choose Access Local Extensions, and pick
WhyLens.trex. - Allow it. When Tableau asks whether to allow the extension, click OK.
- Done. WhyLens reads the worksheets on the dashboard and builds the report. Use Configure to choose sheets, measures, language and colours.
Using Tableau Cloud or Server? An admin may need to allow the extension first. See the admin guide.
Free during early access
We are shaping WhyLens with its first users. Tell us what works, what does not, and what you would like it to find next.